Cooling curves and models of the post-shock:
logN=12; V= 150 | 200 | 300 | 400 | 500 km/s.
V=300 km/s, logN= 10| 11| 12| 13| 14
Combined models of the pre-shock, post-shock and hotspot. The HHeCO models.
logN=12; V= 150 | 200 | 300 | 400 | 500 km/s.
V=300 km/s, logN= 10| 11| 12| 13| 14
Low resolution spectra from the accretion region (pre-shock+post-shock+hotspot, the HHeCO models). The Eddington flux Hλ [erg/s/cm^2/A/sr]
logN=12; V= 150 | 200 | 300 | 400 | 500 km/s.
V=300 km/s, logN= 10| 11| 12| 13| 14
Emerging intensities from the accretion region (pre-shock+post-shock+hotspot)
H α, H β, Br γ,
HeI 4921 A, HeI 5876 A, HeI 6678 A, HeI 10830 A,
HeII 1640 A, HeII 4686 A
The intensities are written in the fits format and can be browsered with your favorite fits viewer. In ds9 fits files look like this:
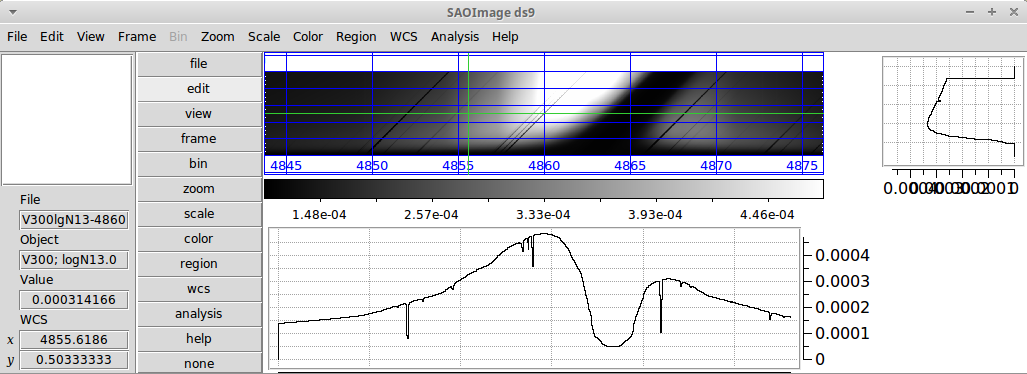
Here the horizontal graph represents the line profile at given μ (see y value), and the vertical graph is for the limb darkening (brightening) at a given wavelength (see x value). All wavelengths are in vacuum.
Related conference paper (2017ASPC..510..110D) and presentation
The hotspot emission in the case of the oblique shock is described in the paper [pdf]