Solar Activity, Weather and Climate
Edward Kononovich, Moscow State University
Abstract.
The Sun is the nearest and most investigated star in the Universe and also it is the source of our life. Only occasionally we can see its face, but usually we dare not even to glance at it, like at the face of God. And we appreciate it by our senses and reason. And that is why we must learn it and know it. Each human being asks in his turn, what is the Sun? The answer is that the Sun is everything for us. It was well known even in the ancient times when the Sun was respected as god. But it is impossible to come over the all aspects of the Sun at once. So from the whole complex of the solar-terrestrial relationships we are going to discuss only the most noticeable variable events. In the Sun-Earth system these are the impulses of the solar activity and the processes in the Earth atmosphere. We use to call them weather and climate. It is evident, that the Sun determines the whole thermal balance of our planet. However only recently we succeeded to prove that the weather anomalies and even that of climate are noticeably connected with the variety and diversity of the solar activity. How and why? And what is the solar activity for the Sun? And what it is to us? Does our life need the solar activity? May be we can only ask, but nevertheless we must try to answer.
What is the Sun?
Please, permit me to compare our divine Daystar with a supernatural living creature and forgive me such boldness. If the Sun may be compared with such creature, its central core is its stomach, or the site, where its fuel is consumed to produce a huge amount of energy. In Fig. 1 this core is in the center.
Its heart is the subsurface convection zone just below the tiny epidermis of the outer visible layers of the photosphere.
The convection zone occupies about 1/3 of the total solar radius. Here originates a beautiful symphony of thousands notes of waves, or oscillations (similar to the acoustic waves in the air). This “music” provides us with large information about nearly the whole Sun. But our ear would not hear the “sounds of the Sun” because their frequencies are about 3 mHz, i.e. in 100 000 times lower then the frequency of the sound we like to hear. The wavelength of the oscillations in the Sun is correspondingly higher by about the same factor. The physician armed with a huge acoustic device could auscultate the Sun interior as he does it for a sick person. Then he would hear the beating of this “solar heart” in its convection zone.
Three instruments on the international Solar Orbital Heliospheric Observatory (SOHO) detect rhythmic changes on the Sun's visible face, due to sound waves reverberating through its interior.
Just as seismologists probe the Earth's interior using earthquake waves, so helioseismologists learn from the sound waves the behavior of the plasma in the Sun's turbulent interior. Special photometers measuring the wave velocities over the solar photosphere permit to find out the length and frequencies of the waves and restore by them the speed of sound inside the Sun. In its turn this permits to prove the temperature distribution over the Sun interior. The measurements of the speed of sound proved that some levels in the solar interior are hotter, some cooler than expected. The main result is that the calculations of the internal parameters of the Sun, made with great effort by the theorists, are very close to the results of this new method to treat the Sun named helioseismology. In Fig. 2 one can see this result: different zones inside the Sun are marked according to very small differences in temperature between “observed” and calculated values and these differences are smaller then 1% of the values.
The same experiment proves that the Sun’s interior also rotates like it is observed at surface layers. In the same time there are also subsurface flows of gas from the equator towards the poles at about 22 m/s (80 km/h).
These results are shown in Fig. 3. It is evident that only in the convection zone the solar rotation has the differential character, i.e. the equatorial zones rotate slightly faster then at the higher latitudes. The structure of the convection zone is sketched in Fig. 4. It is characterized by the upward and downward motions, which topologically are quite different. These motions together with the differential character of the rotation and meridian circulation of the solar matter, due to the slight oblateness of the Sun, provide its most mysterious property – the recurrent appearance or amplification of the strong magnetic fields. All these particularities are specific for the convection zone and extremely important for the whole “life” of the Sun because they are the main causes of the Solar Activity. That is why we propose to name the outer solar convective layers as the heart of the Sun.
To continue this analogy what shall we take as the nerve system of the Sun? Quite simple – it is the whole solar matter presented by the highly ionized ideal plasma, where the oscillations mentioned above can propagate far beyond their cradle which is the convective zone. This “neuron system” as a communicative system serves us by large amount of information concerning the physical parameters inside the Sun.
In contrast to a real solid body the gas sphere of the Sun has no limiting surface. Nevertheless the Sun has the “skin”. It is a tiny layer between the deeper visible and higher usually invisible parts of its outer layers known as the solar atmosphere. This is the layer of the so-called temperature minimum, where the temperature drops as low as 4300 – 4500 K. The most abundant hydrogen atoms are practically neutral here. Nearly only one of the 10 000 of them is ionized. For the Sun this is “cold” plasma and we may consider it as quasi neutral “skin”. All matter outside and inside these layers is highly ionized and it is extremely important for the interconnection of the plasma and magnetic field. In short they are inseparable like members of a good family, but according to the circumstances each of them may be the leader.
At last what are the solar lungs, what is its breath? Certainly it is the solar plasma wind permanently blowing outside the Sun (Fig. 5). This wind is fanning our Earth, or, to be more exact, its magnetosphere which is our main shield.
But all these relations may be only suggestions or speculations of theorists. How can we prove them? The prove of pudding is in its eating. But we can’t even to approach the Sun! Nevertheless SOHO could a little! Virtually we can prove the high level of the temperature in the central core of the Sun and our suggestion that it is a result of the thermo-nuclear reactions. In this case a large amount of fast extremely light particles – neutrino must appear. The experiment Super Kamiokando permits to obtain something like an image of the Sun produced by these remarkable particles. Fig. 6 was obtained during about two years of registration of such an image.
We can also have an impression about the structure of the convection zone. The impulses from its highest layers penetrate into visible layers of the photosphere providing an impressive picture of granulation. It looks like the cumulus in the Earth atmosphere seen from the airliner. Each bright spot in the Fig. 7 is about 1000 kilometers in diameter.
The deeper layers of the convection zone have a larger structure about 50 thousand kilometers in diameter because of their higher hotness. Their imprint made by the magnetic lines of force is observed in the pattern of the chromosphere resembling a network of cells.
Possibly the main structure of the whole convective zone is connected with the giant convective cells. Occasionally they organize in all visible layers of the solar atmosphere a complex of activity. On developed stage such complex incorporate bipolar sunspot group, surrounded by faculae, suddenly disturbed by explosions of the solar flares and decorated by picturesque prominances. (Fig. 8).
What is the Solar Activity?
Now we come to the most serious problem. Frankly, we do not know what the solar activity is. Even we do not know whether it is good or bad for us. And this is the subject of research. On the other hand, we are very good informed about what does it look like, especially due to the outstanding space experiment like SOHO. Each day we can see clearly what happens at the Sun, at every layers of its “multistory” atmosphere.
The most energetic events are the solar flares giving about 1031 – 1032 ergs during the time interval about tens of minutes. This energy is equally divided between the electromagnetic emission (mainly X-ray and hard UV and visible emission) and kinetic energy of fast and even soft relativistic particles. All this energy after diluting in space partly reaches the Earth magnetosphere and all layers of its atmosphere.
The largest solar events often connected with the active regions are the prominances and their dynamic transformation coronal mass ejection (CMS). Figs. 5 and 8 show some of them.
As the most recent example you should look at the impressive movie about the dynamic waves inside the Sun. Figure 9 presents one frame of this movie.
This movie is the reconstruction of the dynamic waves in the convective zone obtained by mathematical processing of the dopplerograms obtained during the last 5-year time interval. It shows propagation of a certain wave with the period about 16 months during this 5 years. By no means this movement is somewhat connected to the origin of different features and events in the solar atmosphere. We can only suggest that the corresponding driver is the solar magnetic field, amplified by some mechanism. Recently Soloviev & Kiritchek (2000) from Kalmyk University in Russia attempted to calculate the result of evolution of the solar magnetic toroids from the bottom of convective zone. Fig. 10 illustrates their results. One can see the similarity of pictures 9 and 10. But similarity is not a proof, which still must be done. Nevertheless many authors on different arguments suggest the existence of a magnetic layer at the bottom of the convective zone. The turbulent convection together with the differential rotation in the convective zone can transport the magnetic force lines, amplifying and supporting the magnetic field. This theory is named solar dynamo for its similarity to the well-known generator of electricity.
The Solar Activity Display
If we do not know what the solar activity is, we are very good aware about its demonstrations. Very long ago people had noticed that “even the Sun has spots”. It was incredible for divine substance, but it was a fact. To regulate this nonsense it was suggested that spots were the unknown planets like Mercury passing in front of the solar disk. But this suggestion failed when famous Galileo proved that the sunspots belong to the body of the Sun.
The most important feature is the 11-year cycle of the sunspot appearance discovered by Heinrich Swabe in 1843. Rudolf Wolf was lucky to introduce his famous relative sunspot number index W, rather satisfactory determining the solar activity as a whole. If this index is not excellent, nevertheless it is the most comprehensive index for the time being. Its daily values are known more or less surely since the middle of XVIII century. The cycle commenced in February 1755 is called number 1. Since those times till July 1996 the 22 full cycles are passed. Now we are living at the epoch of the cycle 23 maximum. Fig. 11 presents the monthly mean W values for the whole this time interval and Fig. 12 is an attempt to predict its pattern for the current cycle 23. We have analyzed all these cycles and noticed intricate feature. Namely, 11year cycles have a tenancy to organize small groups of three cycles (triads). These triads mainly are of 3 kinds: high, low, and monotones (ascending or descending) (Fig. 13). It is amazing, that the cycle numbers of the middle members of triads are divisible by 3. In other words the triads are centered on cycles 3, 6, …21. If it is true, the current cycle 23 is the beginning of a new triad of cycles 23, 24, and 25. Of what kind they will be?
Solar-terrestrial relationships
This is fast developing branch of astrophysics and geophysics. Its subject incorporates a large amount of properties of various layers between the Sun and the Earth and events occurring in them. It is impossible to touch all of them in one lecture. It is important, however, that the most interesting problems concern sudden and anomalous events. We are too accustomed to regular and monotonous character of our environment, in order to notice smooth changes. Russian scientist Alexander Tchijevsky since 1924 was the first to recognize the influence of the Sun on various brunches of ecology, biology and human life (e.g. see Tchijevsky, 1930).
As we have seen, the solar activity is energetic short time variability of the Sun. It should be compared with the most energetic variations in the Earth shells, primarily oceanic and atmospheric. The both, together with the solid surface, accumulate large amount of energy. Variations of this energy due to the Earth rotation (diurnal) and orbital movement (seasonal) are regular. They have nothing with the solar activity. The variations connected with the solar activity are not strictly periodic and that is why they are called cyclic.
The current 23-d solar cycle explicitly demonstrates a rather strong relation between the meteorological and solar activity events suspected by Brükner as long ago as 1890. To prove this it is sufficient to note the close coincidences between the strongest solar flares and the meteorological anomalies occurred during the current years. The chief specific character of the cycle 23 is its coincidence with the epoch of the 100-year solar cycle maximum and that of the Brükner’s cycle. Moreover, the cycle 23 has a marked longitudinal dependence of activity. Thus basing on the daily Wolf numbers the current cycle may reveal the W values comparable with the greatest cycle 19! (Figs. 11, 12). All these relations confirm our previous result about that the 30 – 40 % of the baric anomalies are due to the solar effects (Smirnov and Kononovich 1996). As a result of wide field of investigations it is possible to state that the character and amplitude of the atmospheric response strongly depend on a lot of special conditions. Below is the list of some of them.
Naturaly this list is not complete.
There is an additional hint about the reality of the helio-geomagnetical connections. It is presented by the quasi-biennial oscillations (QBO) discovered both in the solar cycle spectrum and in meteorological processes. The frequency analysis of the meteorological parameter variations shows their global character specific for the middle atmosphere. In these layers a large amount of energy is concentrated in the different kinds of waves. Thus, analysing the energy balance of the Earth atmosphere it is necessary to take into consideration not only the propagation of the different kinds of radiation, but also the transformation, propagation, absorption and reflection of the planetary waves. For example, the increase of wave absorption in the middle atmosphere and their reflection back may be the cause of the global warming and the vice versa (Kononovich and Shefov, 1999).
The balance of rates of the solar energy input and output determines the thermal status of the surface atmosphere. During the solar activity variations there are significant changes of the UV emission intensity and that of the solar coronal streamers and the solar wind. These two components do not influence the terrestrial atmospheric characteristics directly, but through several intermediate processes, which in their turn modulate the energy income to and energy loss from the atmosphere. The solar activity increase leads to decrease the lower atmosphere energy sink and consequently to its warming. On the other hand the solar activity decrease leads to its cooling. The long-term lowering of the solar activity (like during the Mounder minimum) can provoke an atmospheric temperature lowering about 1K during a 100 years. Finally, the both channels of the solar activity together may account for the solar dependence of the climatic regime of the terrestrial atmosphere.
To close this considerations let us look at most impressive demonstration of solar activity influence on the lower layers of our atmosphere.
The new concepts concerning solar-terrestrial relationship research take into account the primary processes of the whole Sun-Earth system (Smirnov and E.Kononovich 1996). Cyclic changes of the general atmosphere circulation are of prime interest as also the transformation and recurrency of circulation forms, which characterize the planetary wave dynamics. It was proved that the enhancement of the geomagnetic activity leads to the increase of the planetary waves, characterized by the meridional circulation form in the 11-year and quasi-biennial cycles. However, quantitative estimations of the solar influence are possible only when one succeeds in dividing the Earth atmospheric disturbances due to thermobaric field into two parts, namely internal and external influences. Such new approach suggests the usage of the events, which have the identical initial geomagnetic and meteorological characteristics, together with the identical history of their development. The synoptically identical situations including the same initial conditions and the same dynamics of the development were selected to make visible geomagnetic effects in the general atmosphere circulation.
The complex analysis of the daily meteorologic and heliogeomagnetic situations for winter months (November-February) of 1890-1966 period was made to choose the identical initial conditions for the stable and enhanced situations. The sea level pressure data at geographic coordinate network in the Northern Hemisphere were used. The latitude step was 5º over the latitude interval 80-35º N, while the longitude step was 10º.
Totally the 37 enhanced situations and 29 quite ones were chosen for transformation of the circulation form under consideration. Then it was possible to draw the Northern Hemisphere maps showing the change of the atmospheric pressure day by day after the initial date of identity for the both cases. These maps illustrate the changes of the atmospheric pressure in the geomagnetically exited cases (including the solar activity effect) in comparison to the variations in geomagnetically quite cases (caused by the atmosphere itself). Subtracting the data of the both maps one can separate the drivers of external influence from the proper atmospheric processes. What is more, it is possible to obtain quantitative estimation of the atmosphere response to the solar influence individually for the different map regions. For example, such approach has permitted to detect for the West-East circulation form the increase of the amplitudes of geomagnetic-atmospheric effects. Namely (Fig. 13), the enhancement of geomagnetic activity leads to the pressure increases by more then 12 HPa over the North Atlantic, Greenland, the Geomagnetic Pole region and Polar Cap. The enhancement of the geomagnetic activity makes stronger the Siberian anticyclone and weakens the anticyclone over the North Europe and the European part of Russia. Also it helps the formation of the wide low-pressure valley over the North part of the Pacific and formation of a high-pressure region over the North-American continent.
The circulation, caused by geomagnetic activity is specified by high gradients near Scandinavian Peninsula, over the Urals and East of Asia, and over the regions of Labrador Strait and the Geomagnetic Pole. All these regions well coincide with energetically active zones of the atmosphere and its regions of high baroiclinic instability. They play the important role in the realization of the solar-atmospheric
effects.
The activation of the energetically active regions occurs after the geomagnetic disturbances. The corresponding regions are West coasts of the Atlantic and the Pacific (the Newfoundland and the Japanese centers) with high temperature contrasts and a vertical wind shift together with baroclinic instability. Scandinavia and Geomagnetic Pole are also energetically active regions.
The baric disturbances appear after the geomagnetic ones in the form of the planetary wave structures with wave numbers from 3 to 4. This corresponds to the result about the selective properties of the baroclinic instability (Smirnov, 1984) and fits the earlier obtained results on the increase of kinetic energy of such waves after the geomagnetic disturbances (Smirnov, 1974).
The map in Fig. 13 shows that the amplitudes of the geomagnetic-atmospheric disturbances attain up to 40 percent of the amplitudes of baric disturbances due to the proper atmospheric processes as far as the considered season (winter) and circulation form W – E are concerned.
One may conclude, that the helio-geomagnetic activity comes out as an agent promoting permission of instability mechanisms in the atmosphere, liberation of useful potential energy and generation of vortical kinetic energy. The disturbances arisen in energetically active zones would be transported along the main zonal flow generating planetary waves with the wave numbers 3 to 4 due to selectivity of the baroclinic instability. This corresponds to the Rossby waves which determine the real circulation forms, where the baric structures arise just after the geomagnetic disturbances. They appear as a superposition of the circulation systems connected both to the proper atmospheric factors and to the influence of geomagnetic disturbances.
All this is obvious since we are living under the Sun and can’t be independent of it in every scale of time and dimension. Poets like Anaksagor and Balmont were right indeed when they clamed: “We came to this world to see the Sun!” But we should add – “and also to feel it”.
References
Brü ckner E.A. 1890. Klima swankungen seit 1700. Wien -Olmü tz.
Schwabe H. 1843. A.N. 495.
Smirnov R. V. and Kononovich E. V., 1996. In: Solar Drivers of Interplanetary and Terrsetrial Disturbances, ASP Conference Series, V. 95. Eds. K.S.Balasubramaniam, Stephan L.Kiel, and Raymond N.Smart. P. 481-488.
Smirnov, R. V. 1974, in Solar-Atmospheric Relationship in the Theory of Climate and Weather Forecast, pg 33-42 (in Russian).
Smirnov, R. V. 1984, Sov. Astron. Journ. 61, 1168.
Smirnov, R. V., Kononovich, E. V., 1993, in Proceedings of the 1992 STEP Symposium/5-th COSPAR Colloquium, (ed. M.Teague). P. 53-58.
Smirnov, R. V., Kononovich, E. V., 1995, Astronom. And Astrophys. transactions, 6, 1.
Soloviev A.A. & Kiritchek E.A. 2000. Astron. & Astroph. Trans., in press.
Tchijevsky A.L. 1930. Cosmic energy as a Factor of Human History. The Seer. 1. No 1, Chartage.
Wolf R. Astron. Mitt. Zürich. 1858 – 1895.
Figure Captions
Fig. 1. The internal structure of the Sun. (Courtesy of NASA). 1. Chromosphere. 2. Spicules. 3. Radiative zone. 4. Convective zone. 5. Core. 6. Corona. 7. Photosphere. 8. High speed solar wind. 9. Coronal hole. 10. Coronal high temperature 2 000 000 degrees. 11. Sunspots. 12. Loop prominance.
Fig. 2. Radial and latitudinal variations of the sound speed in the Sun, relative to a standard solar model. Darker regions correspond to the positive variations (“hotter”), and lighter ones correspond to the negative variations (“cooler” regions).
Fig. 3. Angular velocity of rotation inside the Sun. The darker zones represent the relative faster rotation speeds and the lighter ones the slower zones.
Fig. 4. A schematic structure of the subsurface convective zone.
Fig. 5. The outer parts of solar atmosphere: corona transforming in the solar wind and coronal mass ejections obtained by SOHO.
Fig. 6. Neutrino image of the Sun obtained by Super Kamiokando Experiment.
Fig. 7. Photospheric granulatrion.
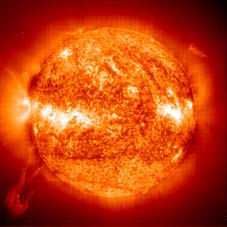
Fig. 8. The active Sun observed in the line 30.4 nm of the ionized helium.
Fig. 9. The dynamic waves in the convective zone (SOHO experiment).
Fig. 10. Evolution of the general magnetic field in the solar convection zone according to Soloviev & Kiritchek (2000).
Fig. 11. Monthly mean sunspot Wolf-numbers since 1750. The triads of cycles are marked by bars. (Courtesy of NASA).
Fig. 12. Prediction of the current solar cycle 23 together with observed everyday Wolf-numbers. (Kononvich et al., to be published).
Fig. 13. The North Hemisphere map showing the isolobars (the lines of the equal baric pressure change due to a heligeomagnetic disturbance for the West-East atmospheric circulation form. The increase of the amplitudes of the geomagnetic-atmospheric effects attains about 12 HPs i.e. about 40% of the pressure increase produced by the proper atmospheric processes.
Edward Kononovich, Moscow State University
Solar Activity, Weather and Climate
What is the Sun?
What is the Solar Activity?
The Solar Activity Display
Solar-atmospherical relationships
References
Brü ckner E.A. 1890. Klima swankungen seit 1700. Wien -Olmü tz.
Schwabe H. 1843. A.N. 495.
Smirnov R. V. and Kononovich E. V., 1996. In: Solar Drivers of Interplanetary and Terrsetrial Disturbances, ASP Conference Series, V. 95. Eds. K.S.Balasubramaniam, Stephan L.Kiel, and Raymond N.Smart. P. 481-488.
Smirnov, R. V. 1974, in Solar-Atmospheric Relationship in the Theory of Climate and Weather Forecast, pg 33-42 (in Russian).
Smirnov, R. V. 1984, Sov. Astron. Journ. 61, 1168.
Smirnov, R. V., Kononovich, E. V., 1993, in Proceedings of the 1992 STEP Symposium/5-th COSPAR Colloquium, (ed. M.Teague), pg 53-58.
Smirnov, R. V., Kononovich, E. V., 1994, in Magnetic fields of the Sun and helioseismology, (ed. Yu. I. Vitinskij), pg 140-148 (in Russian) Smirnov, R. V., Kononovich, E. V., 1995, Astronom. And Astrophys. transactions, 6, 1.
Soloviev A.A. & Kiritchek E.A. 2000. Astron. & Astroph. Trans., in press.
Tchijevsky A.L. Cosmic puls of life. (Russian). “Mysl”. Moscow. 1995. 768 pp.
Wolf R. Astron. Mitt. Zürich. 1858 – 1895.